Making the Invisible Visible
Web • IOS • Wireframes • Flowcharts • User Interface • Animation • Prototyping
Project Snapshot
The Big Idea
IoT brought billions of new devices into networks — cameras, sensors, medical machines, printers. Security teams were blind to risks. I created a living map that made the invisible visible — and gave teams clarity and confidence.
The Human Problem
At 2am, Complexity is the enemy
Too many Dashboards
Too many logs
Too many false alarms
My Role
I led UX design end-to-end: from research and strategy through flows, prototyping, and stakeholder alignment, partnering closely with PM, engineering, and security SMEs
The Evolution
We removed distractions and highlighted the main points to make data easy to understand.
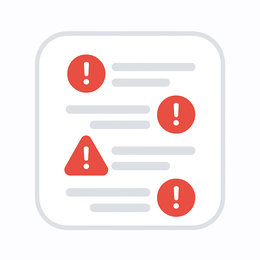
BEFORE
Too many alerts, hard to focus.
AFTER
Clarity at a glance
Solution
An IoT Security Map — devices, roles, and risks in one view.
See every connection live.
Spot traffic and risks instantly.
Act directly on the map.
What was once constant alerts became a clear, living overview of security.
The Growth Potential
Analysts didn’t need more dashboards. They needed one clear view.
Device view — health, status, risk.
Connection view — traffic, exposure, detail.
The Resulting Design Principles
Clarity first. Legible at a glance.
Context always. Role, health, traffic visible.
Scale without noise. From hundreds to millions — never chaos.
The Experience, Alive
One map. Two perspectives.
See every connection in real time.
Grasp criticality at a glance.
Act without leaving the map
What was once endless alerts became a living, breathing view of security.
Key Features
Unified Map — Displays all devices, color-coded by health, clustered by location.
Devices Table — Provides a detailed, sortable list view of all devices with metadata for quick scanning
At-a-Glance Risk — Each device shows a Purdue level and vulnerability score.
Contextual Traffic View — Connections highlight traffic volume and risky or denied paths.
Inline Controls — Quick actions appear directly on the map without disrupting the flow.
From Sketch to System:
Icons designed to be clear at a glance, effective at small sizes, and consistent across the platform.
From Static to Actionable:
Goals: Turn maps into mission control
Inline actions replace passive visuals
Risks become triggers for immediate response
Flow: See it → Fix it T→ Move on
Final Design
Prototype in hand.
Leadership saw the map come alive, with devices, connections, risks.
Real time. Clear. Human.
The room leaned in. Support was unanimous.
The Human Impact
The IoT Security Map didn’t just show devices.
It became a decision-making tool that gave analysts confidence.
Proactive, not reactive — teams stopped chasing cleanup and started preventing risk.
Confidence unlocked — uncertainty gave way to clarity and faster action.
Adoption surged — security + IT aligned around one map.
Faster + sharper — less context-switching, fewer errors.
Built to grow — scalable for AI insights and automation.
Closing Notes
One map. One flow. From risk to action.
The IoT Security Map transformed scattered, multi-screen workflows into a single, unified experience. By combining Illumio’s policy engine with Armis’s device visibility, admins gained the ability to see every asset, spot risks, and act instantly — without ever switching context.
This project shows how user research, design strategy, and engineering collaboration can turn enterprise complexity into clarity at scale. Delivered in just 12 weeks (6 sprints), the Security Map improved usability today while establishing a scalable design framework for tomorrow’s integrations and growth.


