Designing Security Without Disruption
Web • IOS • Wireframes • Flowcharts • User Interface • Animation • Prototyping

Context
Overview:
Security teams often face huge lists of vulnerabilities but little guidance on which ones are actually dangerous. Important risks get buried, while small issues clutter the view. On top of that, teams have to jump between different dashboards just to investigate or take action.
I designed Vulnerabilities Insights, a dashboard that highlights the vulnerabilities that matter most and makes it easy to act on them in one place. The project also introduced a new slideout design for quick details without losing your place, and a Wiz integration to bring in richer data during onboarding.
Project Snapshot
Role
I led UX design end-to-end: from research and strategy through flows, prototyping, and stakeholder alignment, partnering closely with PM, engineering, and security SMEs.
Challenge
Previously, if admins wanted to answer questions like:
- Which vulnerabilities could really impact my most important apps?
- How do I see the traffic paths that make these issues exploitable?
- Can I fix the problem without leaving the page I’m on?
…they had to switch between multiple dashboards and manually piece everything together. This slowed them down and increased the chance of missing something important.
Solution
Actionable Vulnerabilities Dashboard
- Focus on what matters — Vulnerabilities are ranked not just by severity scores, but by whether they expose critical applications.
- Act in place — Admins can take direct action (label, isolate, or block risky traffic) right from the dashboard.
- Quick scanning — Grouping by application, role, and exposure score makes patterns stand out instantly.
Wiz Onboarding Integration
- Simpler setup — Workflow designed to pull vulnerability data directly from Wiz during onboarding.
- Stronger insights — Merging Wiz data with Illumio’s traffic intelligence gave admins a much clearer risk picture.
- Future-ready — Built as a framework to support additional integrations going forward.
Impact
Faster investigations
Admins could move from “problem spotted” to “action taken” without switching dashboards.
Better accuracy
By focusing on exposure and traffic context, teams avoided wasting time on low-risk issues.
Scalable design
The slideout and integration patterns are now being reused across the platform.
Higher value for customers
Positioned Illumio as not just a visibility tool, but as a platform for actionable risk reduction.
Key Features
Unified Map — Displays all devices, color-coded by health, clustered by location.
Devices Table — Provides a detailed, sortable list view of all devices with metadata for quick scanning
At-a-Glance Risk — Each device shows a Purdue level and vulnerability score.
Contextual Traffic View — Connections highlight traffic volume and risky or denied paths.
Inline Controls — Quick actions appear directly on the map without disrupting the flow.
Design Evolution
From Cluttered to Clear
Goals: Clarity at enterprise scale.
Dense ioT Device tables simplified with AG Grid
Quick filters surface what matters most
Rich metadata in context, not hidden away
From sketch to system
Goals: Create a series a scalable components
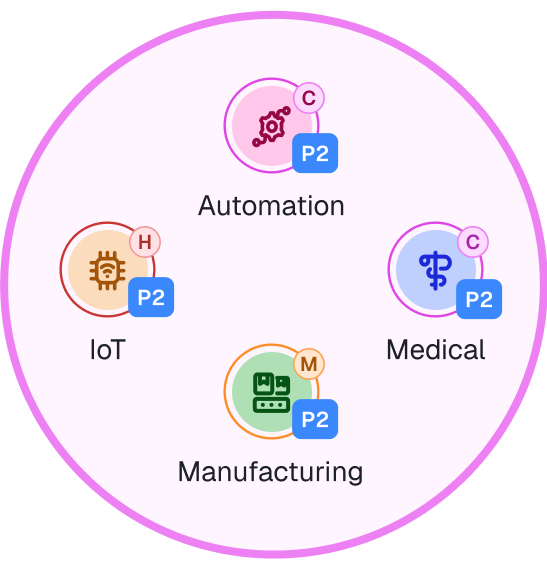
These icons were designed to work across the map, inventory tables, labeling pills, and the insights dashboard.
Each had to be memorable at a glance, effective at small sizes, and carefully balanced so they never overshadowed the status badge (top right) or the Purdue score (bottom right).
From Static to Actionable
Goals: Turn maps into mission control
Inline actions replace passive visuals
Risks become triggers for immediate response
Flow: See it → Fix it T→ Move on
Final Design
Completed prototype and demo to leadership:
After finalizing the proof of concept, I built a working prototype and demoed it to leadership. The walkthrough highlighted how the IoT map could visualize device health, connections, and risks in real time. The project was well received, validating the approach and securing full support for the next phase.
Outcome & Recognition
The Vulnerabilities Insights project changed how Illumio users approach vulnerability management. By shifting from static lists to an actionable, context-rich dashboard, admins can now move from awareness to action in a single workflow. The new slideout component also became a reusable design pattern across the platform, while the Wiz integration brought in richer data during onboarding.
The project earned recognition across the board:
Inside Illumio — leadership called it a model for simplifying complex workflows.
Industry — analysts highlighted Illumio’s evolution toward exposure-based risk reduction, directly supported by this work.
Customers — early demos showed excitement about fixing issues directly in the dashboard and connecting Wiz data seamlessly.
Together, these outcomes positioned Illumio as more than a visibility tool — a platform that empowers security teams to reduce risk proactively